
Volume Spread Analysis (VSA) Trading: A Complete Guide

Core Principles of VSA
The Three Key Variables
VSA examines three critical components for each price bar:
- Volume - The amount of trading activity (effort)
- Spread/Range - The difference between high and low prices
- Closing Price - Where the price closes within the range
The Effort vs. Result Principle
The fundamental premise of VSA is the effort-versus-result relationship:
- Effort = Volume (how much trading activity occurred)
- Result = Price movement (the actual price change achieved)
When effort and result are in harmony, the trend continues. When they diverge, it signals potential trend changes.
The Smart Money Concept
VSA is based on identifying the activities of "Smart Money" - institutional traders, market makers, and professionals who:
- Have superior market information
- Control large amounts of capital
- Can influence price movements
- Use media and market psychology to their advantage
The VSA Market Cycle
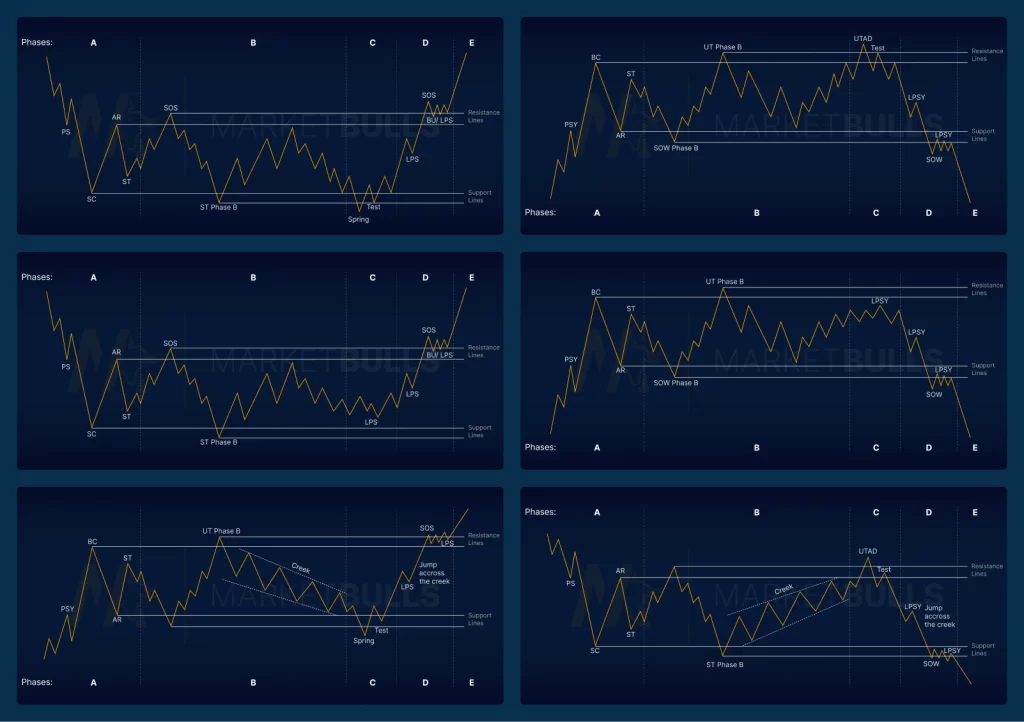
VSA follows a cyclical pattern with five key phases:
1. Accumulation Phase
- Smart Money quietly buys while retail investors sell
- Price declines on increasing volume
- Media often promotes negative sentiment
- Professional traders "fill their warehouses" at wholesale prices
2. Distribution Phase
- Smart Money begins moving prices higher
- Media sentiment turns positive
- Price rises as institutions distribute to retail investors
- Volume patterns show institutional selling
3. Testing Supply
- Smart Money tests if there are remaining sellers
- Minor selling campaigns to gauge market reaction
- Low volume selling to see if demand emerges
- Preparation for next accumulation phase
4. Testing Demand
- Testing if buying pressure has been absorbed
- Ensuring retail demand from distribution phase is exhausted
- Smart Money prepares for next selling campaign
- Price may move sideways or show minor declines
5. Selling Climax
- Final stage where Smart Money initiates major selling
- Media promotes bearish sentiment
- Retail investors panic sell
- Cycle begins again with new accumulation
Key VSA Trading Signals
Bullish Signals (Signs of Strength)
1. Selling Climax
- Wide spread down bar on very high volume
- Closes middle to high of the range
- Indicates panic selling absorbed by Smart Money
- Often marks major bottoms
2. Stopping Volume
- High volume on down bar with narrow spread
- Shows professional support/buying
- Price unable to continue falling despite volume
3. No Supply
- Up bar on low volume after selling climax
- Indicates lack of selling pressure
- Confirms professional accumulation
Bearish Signals (Signs of Weakness)
1. Buying Climax
- Wide spread up bar on very high volume
- Closes middle to low of the range
- Shows exhaustion of buying pressure
- Often marks major tops
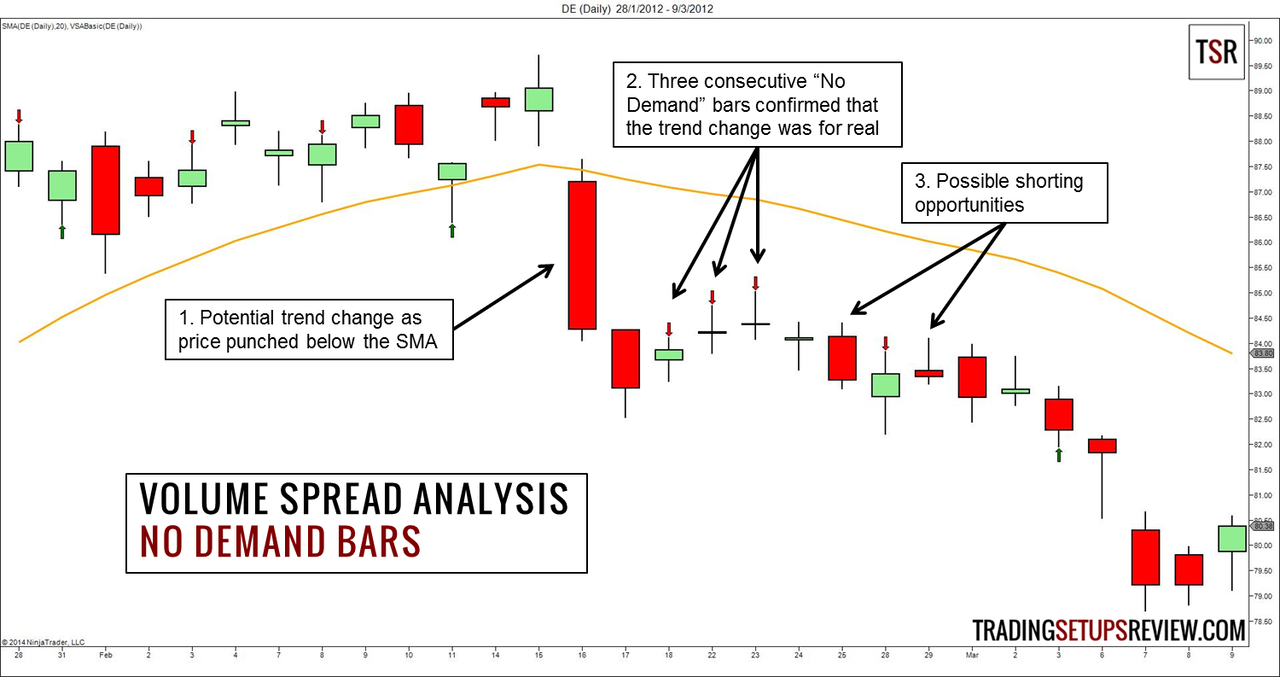
2. No Demand
- Up bar on low volume in uptrend
- Shows lack of professional buying interest
- Warning of potential trend reversal
3. Upthrust
- Bar that moves above recent highs but closes lower
- Shows false breakout and professional selling
- Often leads to significant declines
VSA vs. Traditional Technical Analysis
Advantages of VSA:
- Identifies market manipulation by institutions
- Predicts trend changes before they occur
- Combines multiple data points (price, volume, spread)
- Works across all timeframes and markets
- Reveals true supply and demand dynamics
Limitations:
- Complex interpretation requires experience
- Not purely mechanical - requires judgment
- Volume data quality varies by broker/market
- Best on daily+ timeframes for reliability
Practical VSA Trading Strategy
Setup Requirements:
- Reliable volume data from your broker
- Candlestick charts for proper analysis
- Daily or higher timeframes for best results
- Understanding of market context and trends
Trading Approach:
- Identify the current market phase (accumulation, distribution, etc.)
- Look for volume/price divergences that signal changes
- Wait for confirmation signals before entering trades
- Use price action patterns to time entries and exits
- Manage risk with appropriate stop losses
Entry Signals:
- Buy after selling climax with stopping volume
- Sell after buying climax or upthrust on high volume
- Enter on breakouts confirmed by volume analysis
- Use support/resistance levels for precise timing
Modern Applications
VSA principles are increasingly used in:
- Cryptocurrency trading for identifying whale activities
- Forex markets to spot institutional positioning
- Stock trading for earnings and news-driven moves
- Algorithmic trading systems and indicators
The methodology remains highly relevant because it focuses on the eternal market dynamics of supply, demand, and institutional behavior rather than temporary technical indicators.
Volume Spread Analysis provides traders with a powerful framework for understanding market psychology and institutional behavior, making it an invaluable tool for serious traders looking to align themselves with Smart Money rather than fighting against it.


 Trading: A Complete Guide)
0 Comments